Create Pivot Charts


Do you know how to create a pivot chart from your existing pivot table?
note
Pivot chart can help make your worksheets more manageable by summarising data, and allow you to quickly change the portion of data displayed, like a pivot table report.
Step 1#
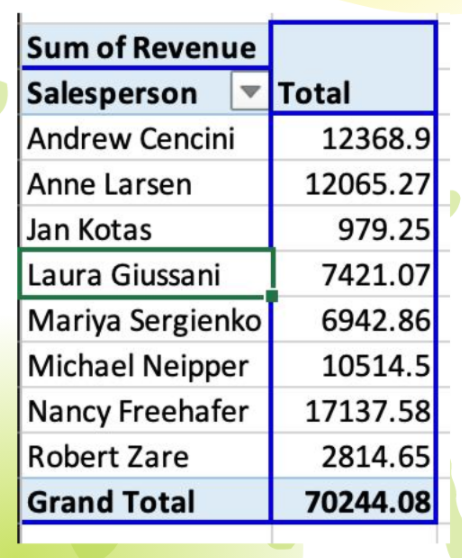
Click any cell inside the pivot table.
Step 2#
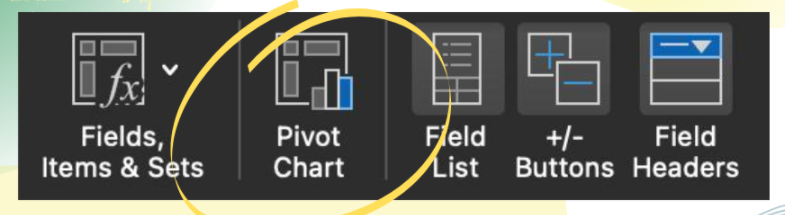
Analyze table, and click Pivot Chart.
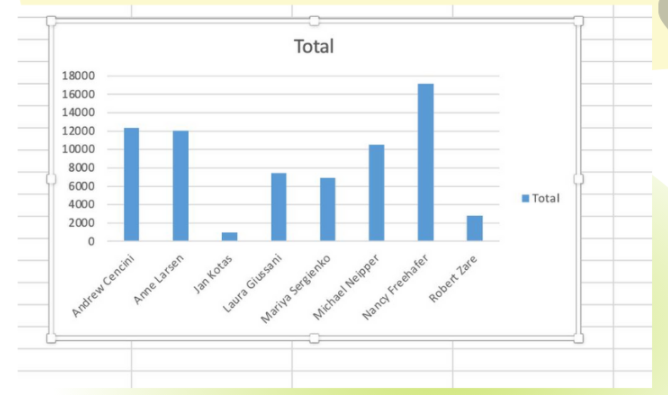
A Pivot Chart will then be generated as shown below.
Step 3#
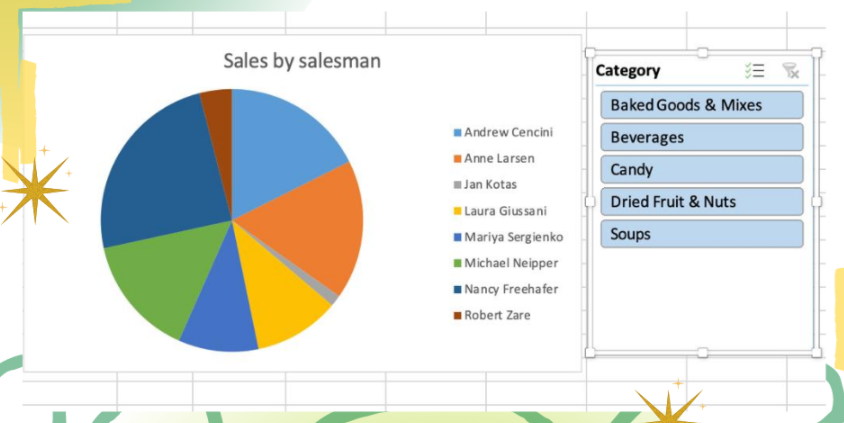
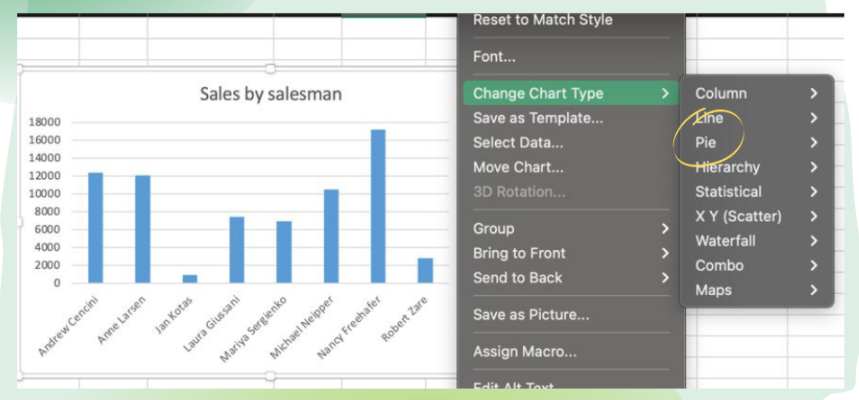
Double click on chart then choose Change Chart Type, and select Pie.
Step 4#
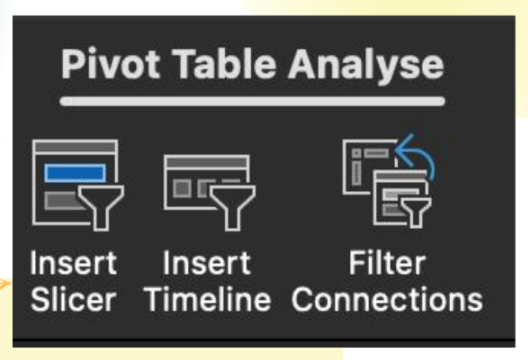
Click Pivot Table Analyze, and click Insert Slicer.
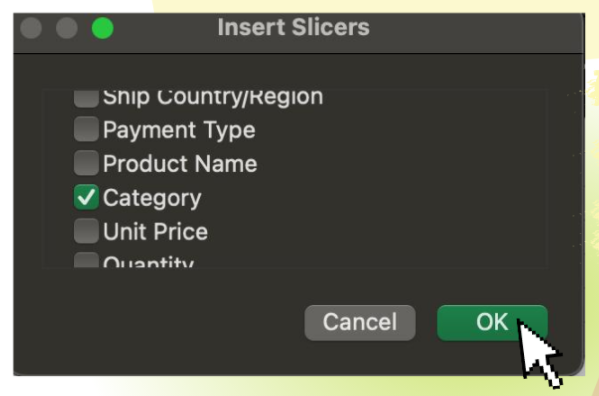
After that, choose Category, and then click OK.
Voila! 🎊#