Create Pivot Tables


Want to create different views of reports for large data sets without altering the original data table?
Let pivot tables in Excel do the work for you!
This simple tutorial will provide a guide on how to create a pivot table.
Step 1 😱#
Select the cell we want to create a Pivot Table from.
note
Cells should NOT have empty columns or rows.

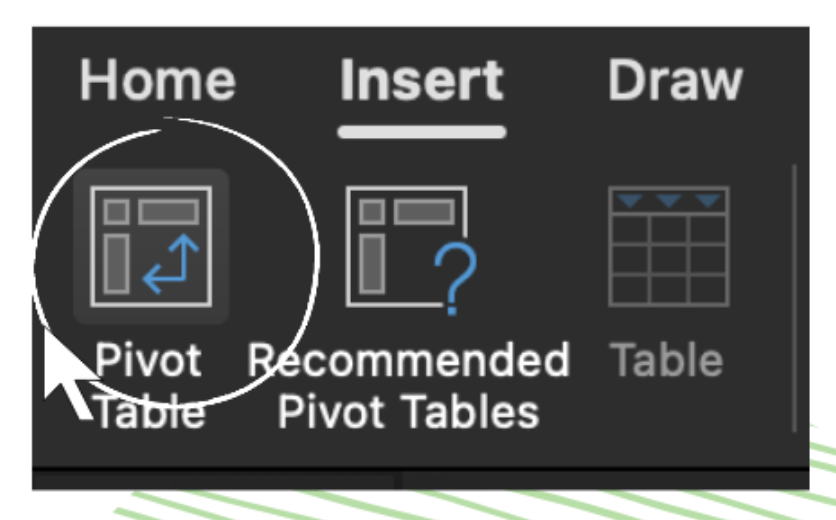
Step 2#
Go to "Insert" > "Pivot Table"
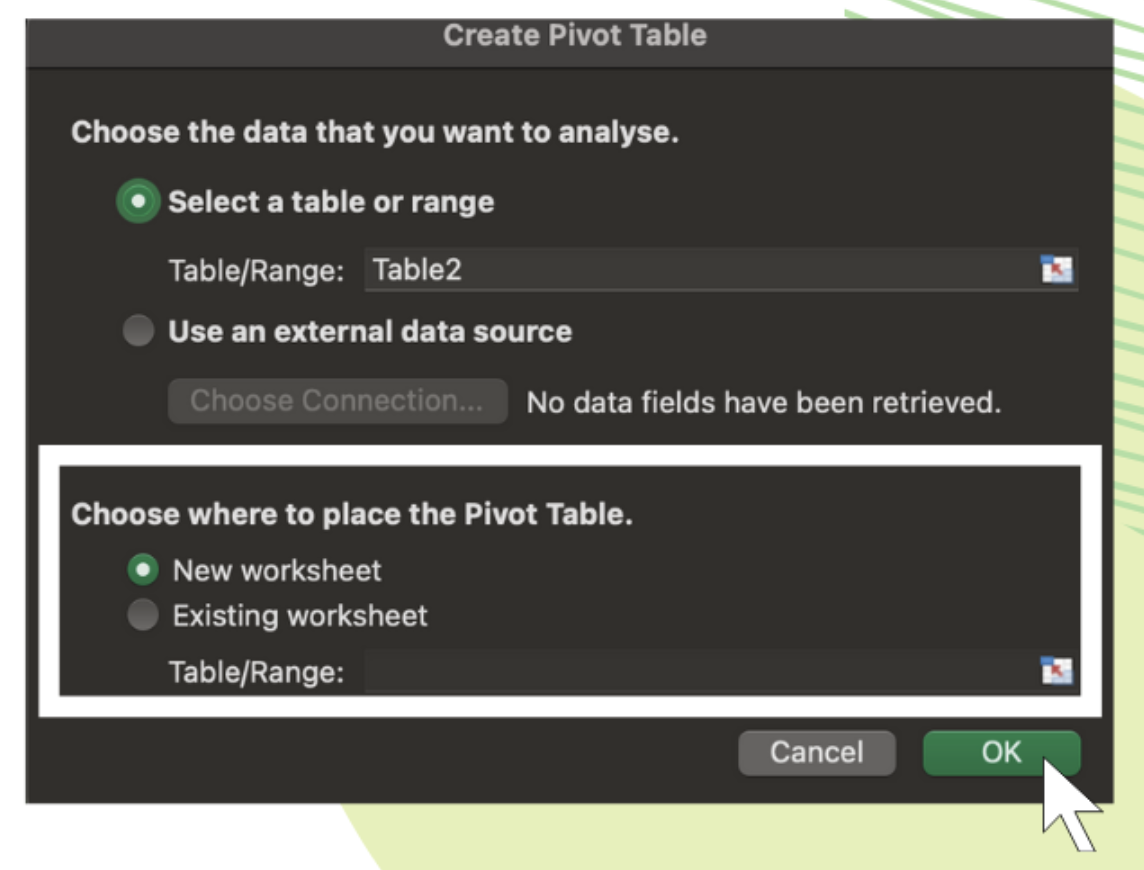
Step 3#
Choose where the Pivot Table report to be placed at, then click "OK"
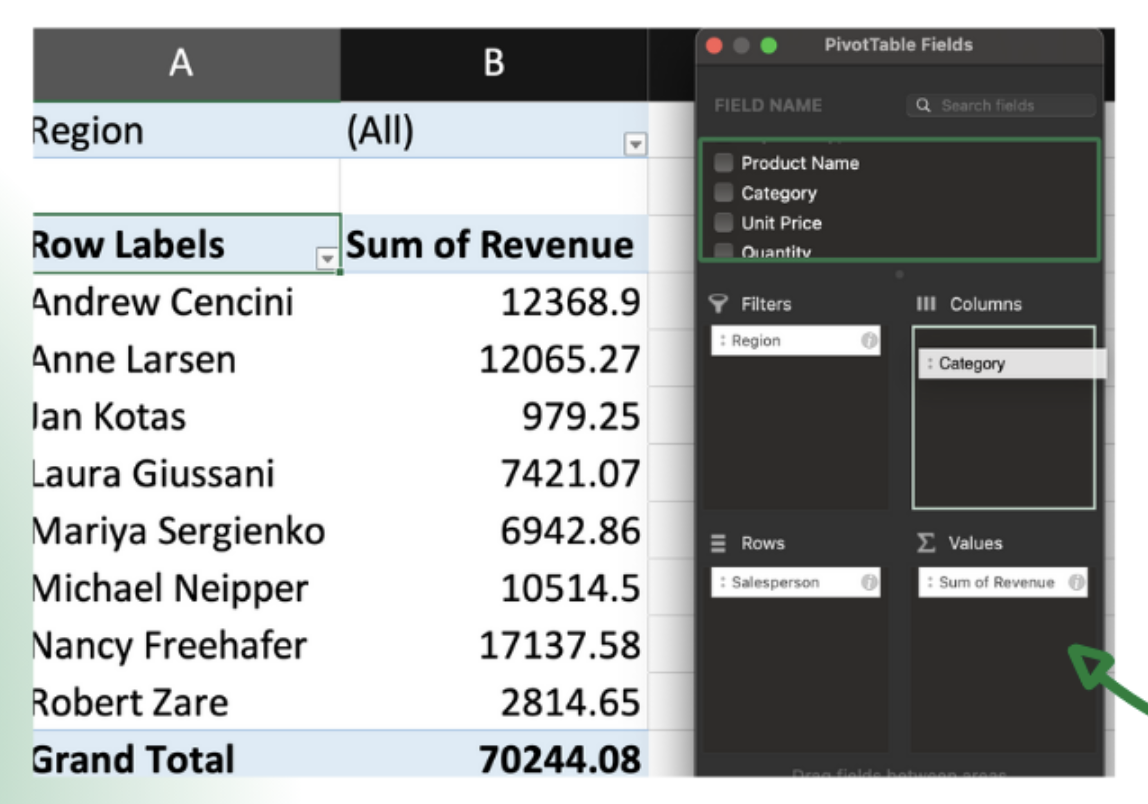
Step 4#
To move a field from one area to another, drag the field to the target area.
e.g., find the salesman and drag it into Rows. Same goes to revenue, region, and product category.
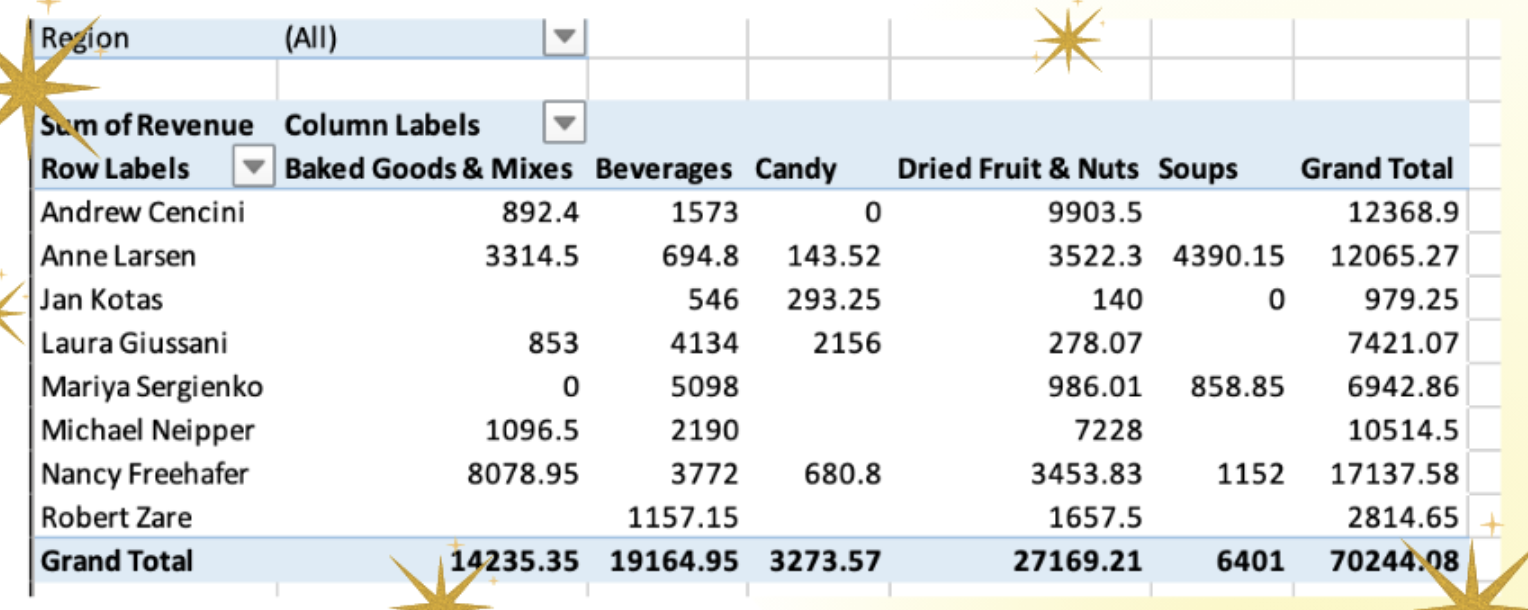
TADAAA!! 🎊#